Prometheus is a free software application used for event monitoring and alerting. It records real-time metrics in a time series database built using a HTTP pull model, with flexible queries and real-time alerting.
The following will be covered here
- Manual Install prometheus on Ubuntu
- Add remote endpoint to allow prometheus to scrape proxy (haproxy) stats
- Install and configure Grafana
- Import HA proxy dashboard to have visibility on query and history traffic
- Configure Node exporter for full visibility in on host resources - not yet complete
- Configure a telegram bot
- Configure contact point
- Configure Alerting in Grafana to post alert messages to telegram
- Automate deploy using Ansible playbook - not yet complete
Manual Install prometheus on Ubuntu
#------install Prometheus begin------
export RELEASE="2.2.1"
sudo useradd --no-create-home --shell /bin/false prometheus
sudo mkdir /etc/prometheus
sudo mkdir /var/lib/prometheus
sudo chown prometheus:prometheus /etc/prometheus
sudo chown prometheus:prometheus /var/lib/prometheus
cd /opt/
wget https://github.com/prometheus/prometheus/releases/download/v2.26.0/prometheus-2.26.0.linux-amd64.tar.gz
sha256sum prometheus-2.26.0.linux-amd64.tar.gz
tar -xvf prometheus-2.26.0.linux-amd64.tar.gz
cd prometheus-2.26.0.linux-amd64
sudo cp /opt/prometheus-2.26.0.linux-amd64/prometheus /usr/local/bin/
sudo cp /opt/prometheus-2.26.0.linux-amd64/promtool /usr/local/bin/
sudo chown prometheus:prometheus /usr/local/bin/prometheus
sudo chown prometheus:prometheus /usr/local/bin/promtool
sudo cp -r /opt/prometheus-2.26.0.linux-amd64/consoles /etc/prometheus
sudo cp -r /opt/prometheus-2.26.0.linux-amd64/console_libraries /etc/prometheus
sudo cp -r /opt/prometheus-2.26.0.linux-amd64/prometheus.yml /etc/prometheus
sudo chown -R prometheus:prometheus /etc/prometheus/consoles
sudo chown -R prometheus:prometheus /etc/prometheus/console_libraries
sudo chown -R prometheus:prometheus /etc/prometheus/prometheus.yml
echo '
[Unit]
Description=Prometheus
Wants=network-online.target
After=network-online.target

[Service]
User=prometheus
Group=prometheus
Type=simple
ExecStart=/usr/local/bin/prometheus \
    --config.file /etc/prometheus/prometheus.yml \
    --storage.tsdb.path /var/lib/prometheus/ \
    --web.console.templates=/etc/prometheus/consoles \
    --web.console.libraries=/etc/prometheus/console_libraries

[Install]
WantedBy=multi-user.target' > /etc/systemd/system/prometheus.service
sudo systemctl daemon-reload
sudo systemctl start prometheus
sudo systemctl enable prometheus
apt-get install -y firewalld
firewall-cmd --add-port=9090/tcp --permanent
service firewalld reload
#------------------------------------
Add remote endpoint to allow prometheus to scrape proxy stats
Example use here will be the following setup from which you would like to scrape.
frontend stats
        mode http
        bind 172.168.30.10:8404
        option http-use-htx
        http-request use-service prometheus-exporter if { path /metrics }
        stats enable
        stats uri /stats
        stats refresh 10s
Install and configure Grafana
Grafana will be configured here to use prometheus as a datasource for viewing the time scaled data (data over time for as long as your retention is set on the datasource db for prometheus)
#------install Grafana begin------
wget -q -O - https://packages.grafana.com/gpg.key | sudo apt-key add -
echo "deb https://packages.grafana.com/oss/deb stable main" | sudo tee -a /etc/apt/sources.list.d/grafana.list
sudo apt-get update
sudo apt-get install -y grafana
sudo systemctl start grafana-server
sudo systemctl enable grafana-server.service
firewall-cmd --add-port=3000/tcp --permanent
service firewalld reload
service grafana-server start
#---------------------------------
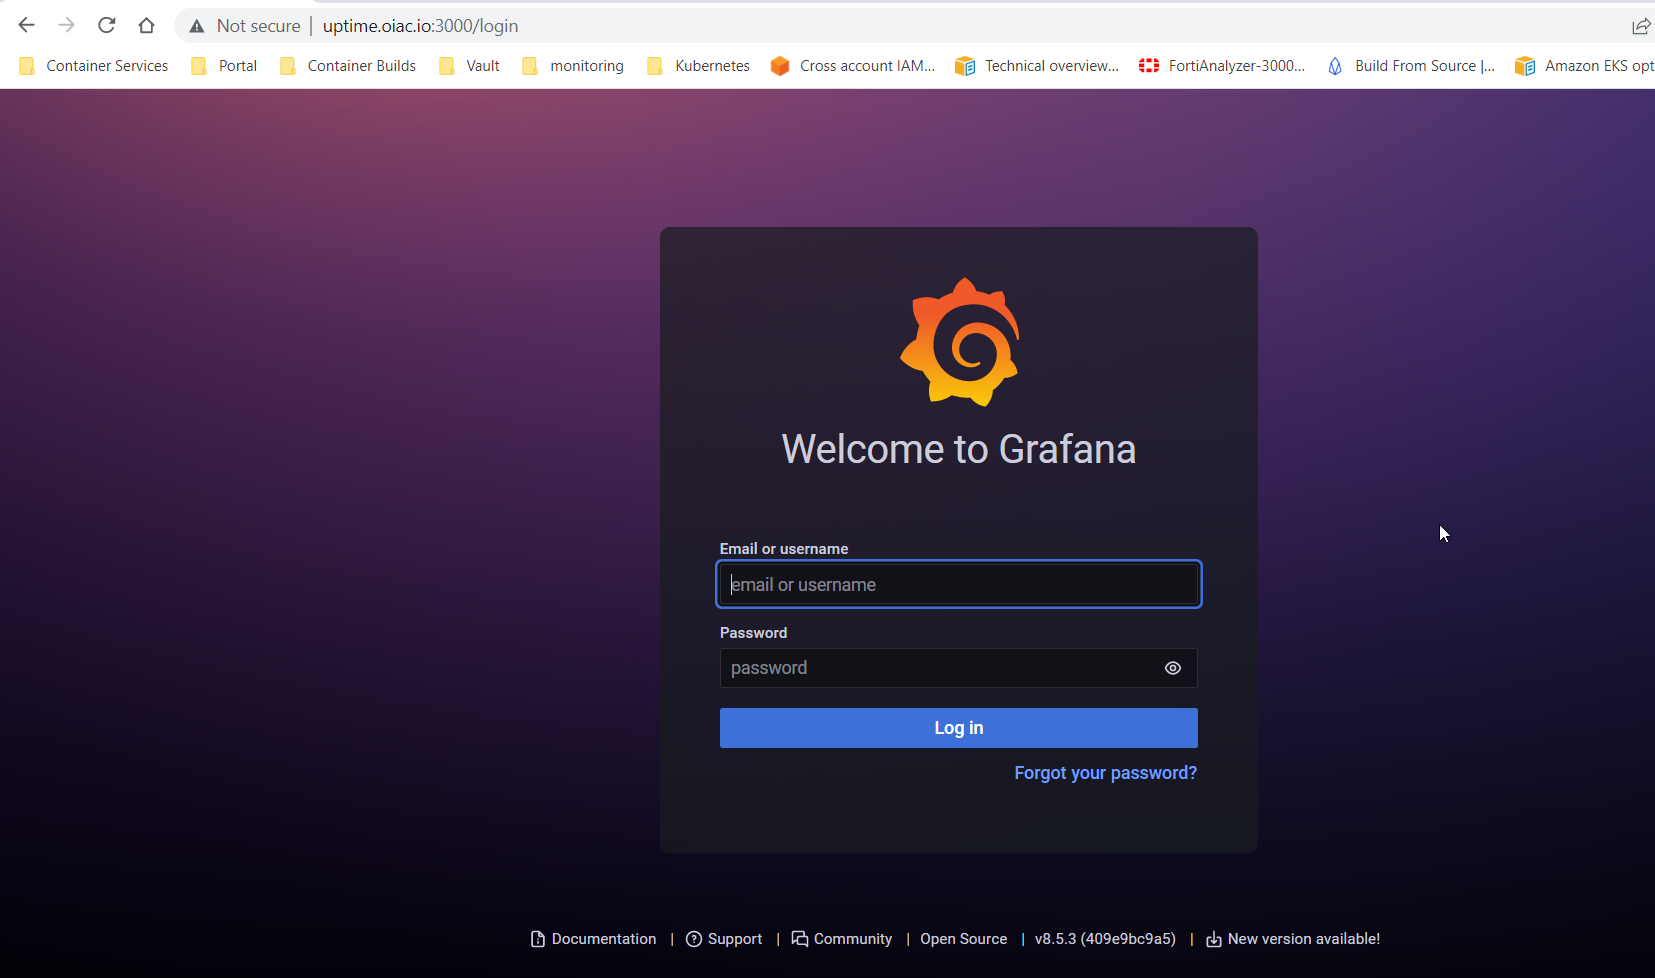
Connect to the Grafana interface via your public/private ip, or a DNS address you have configured
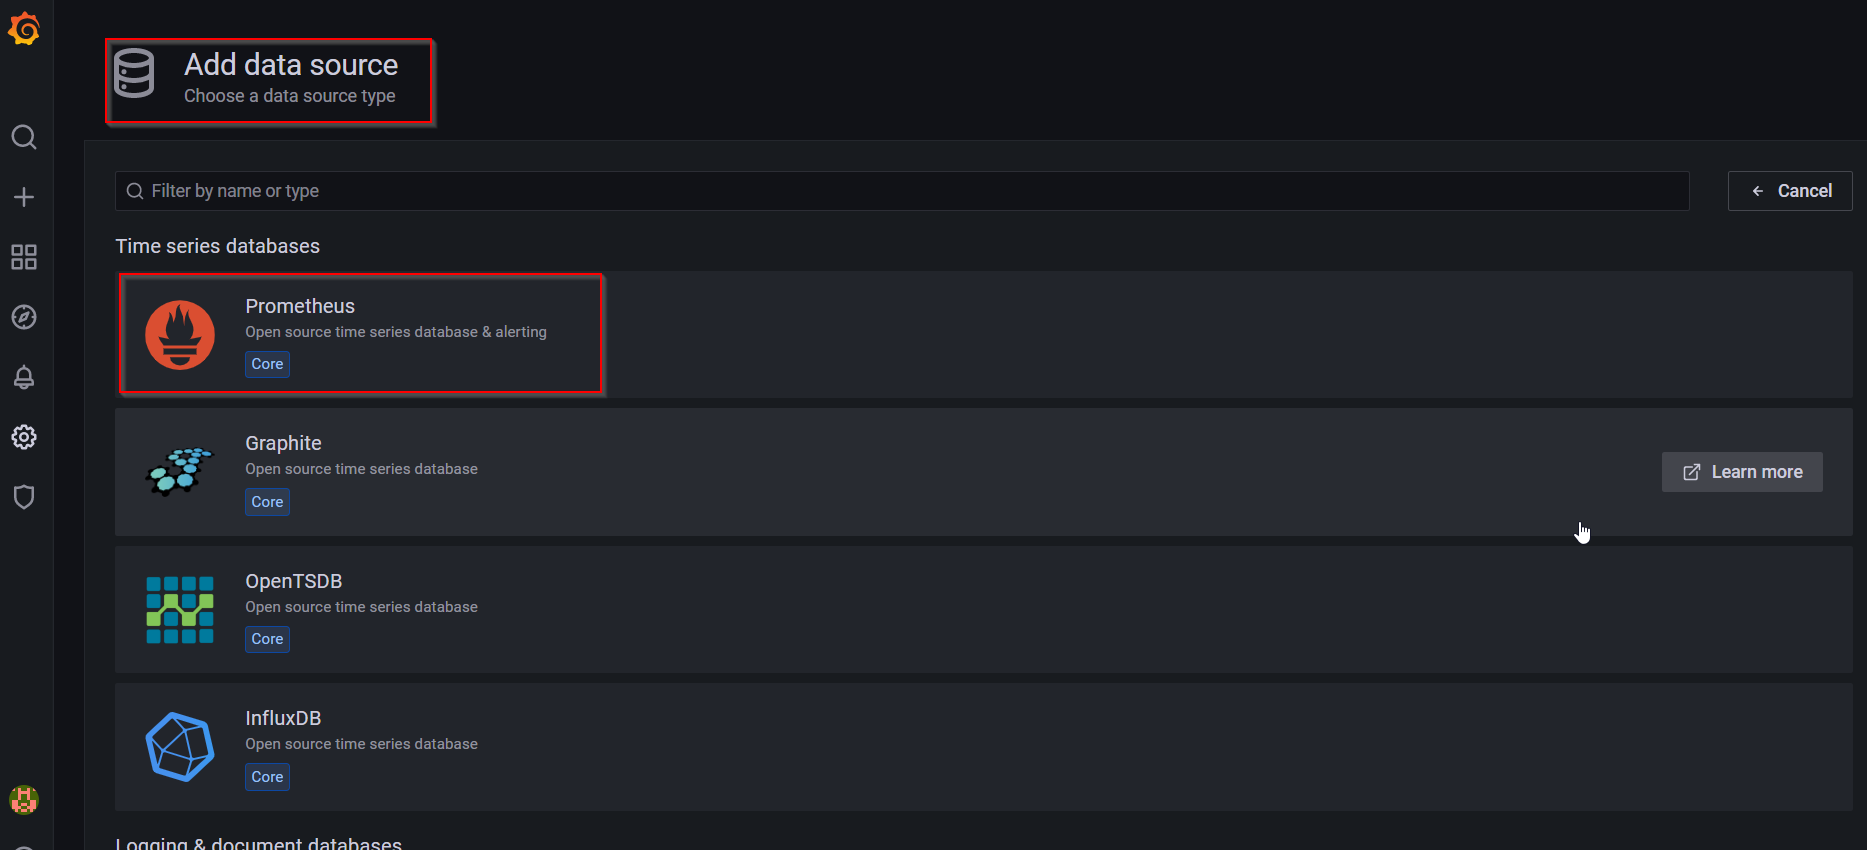
Select to configure a prometheus datasource for your monitoring data
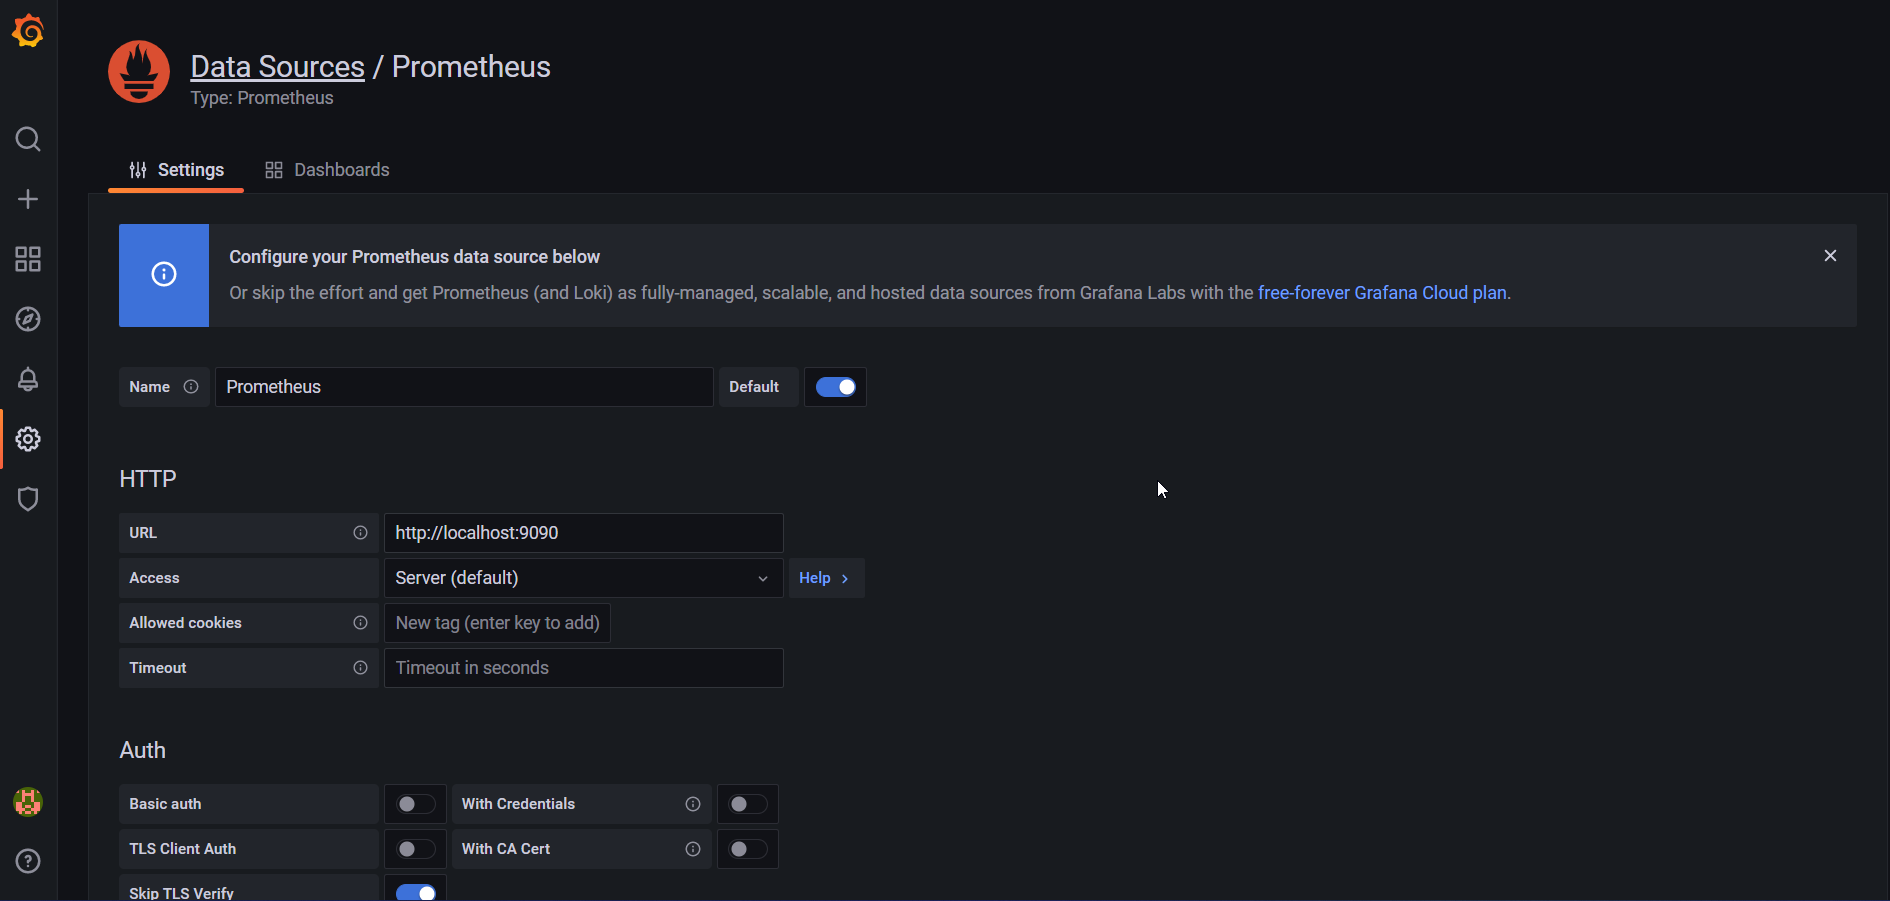
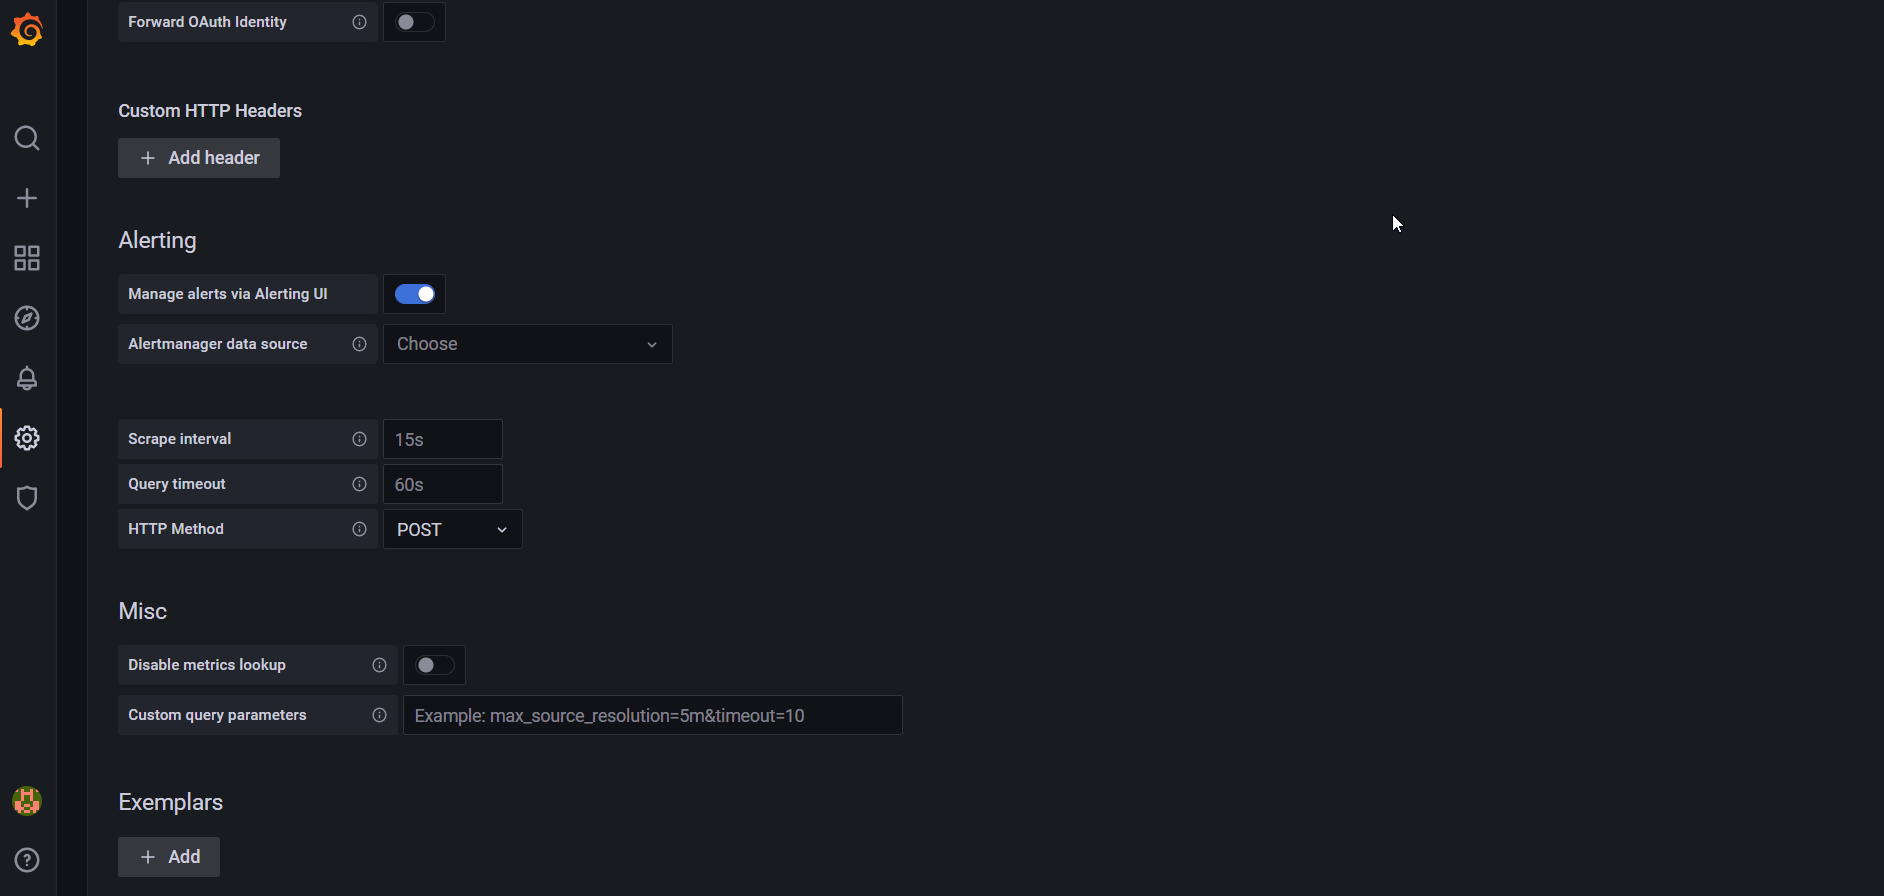
Configure your prometheus datasource
Import HA proxy dashboard to have visibility on query and history traffic
Load you haproxy2 dashboard
Please find the dashboard json to import here
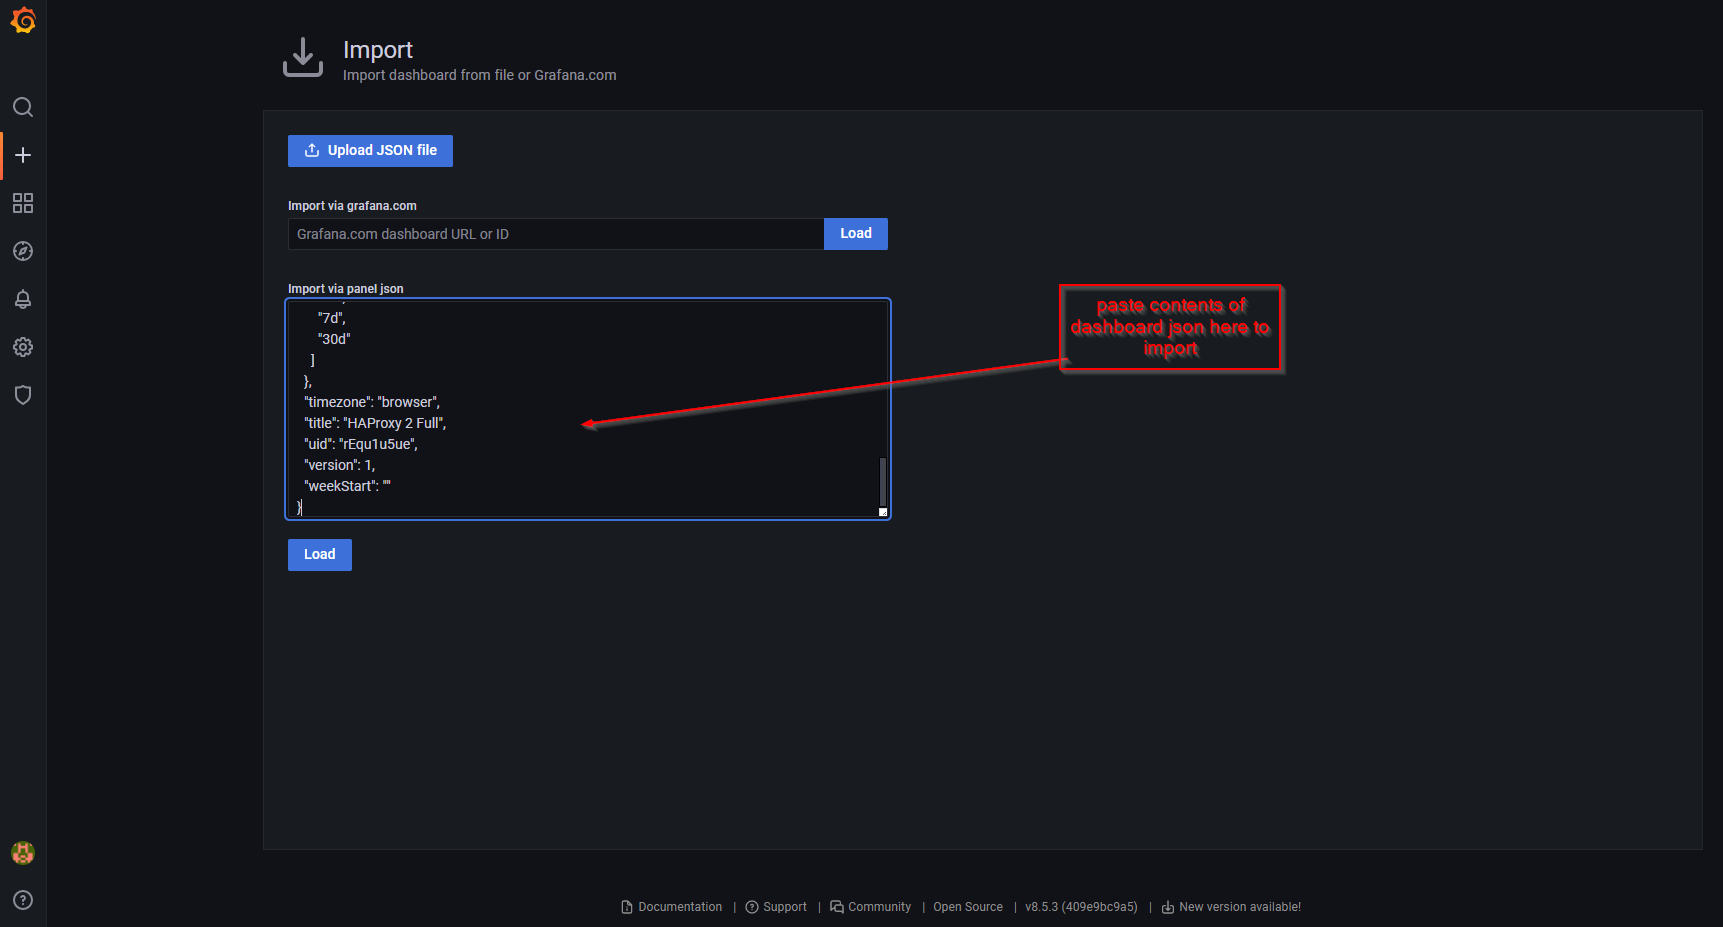
Continue with the prompts until the dashboard is installed
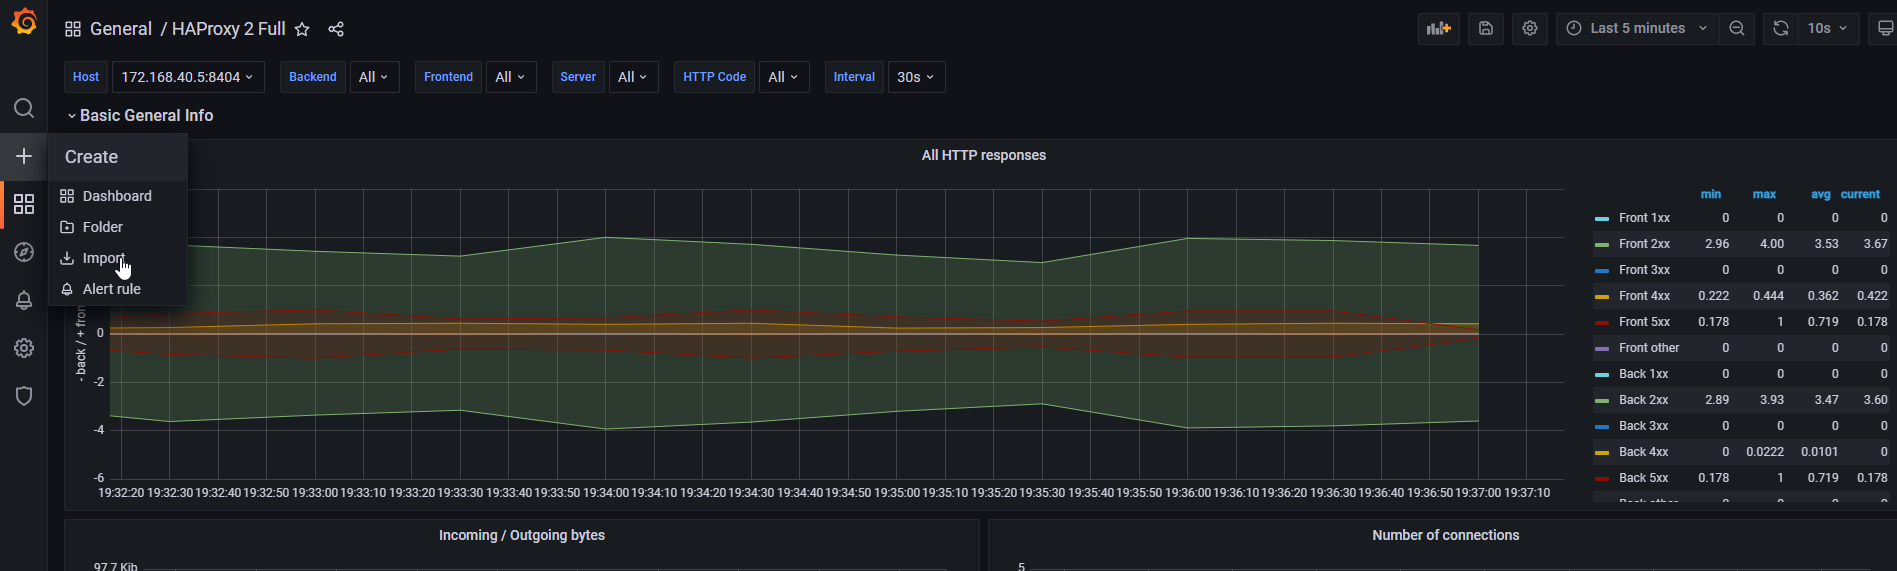
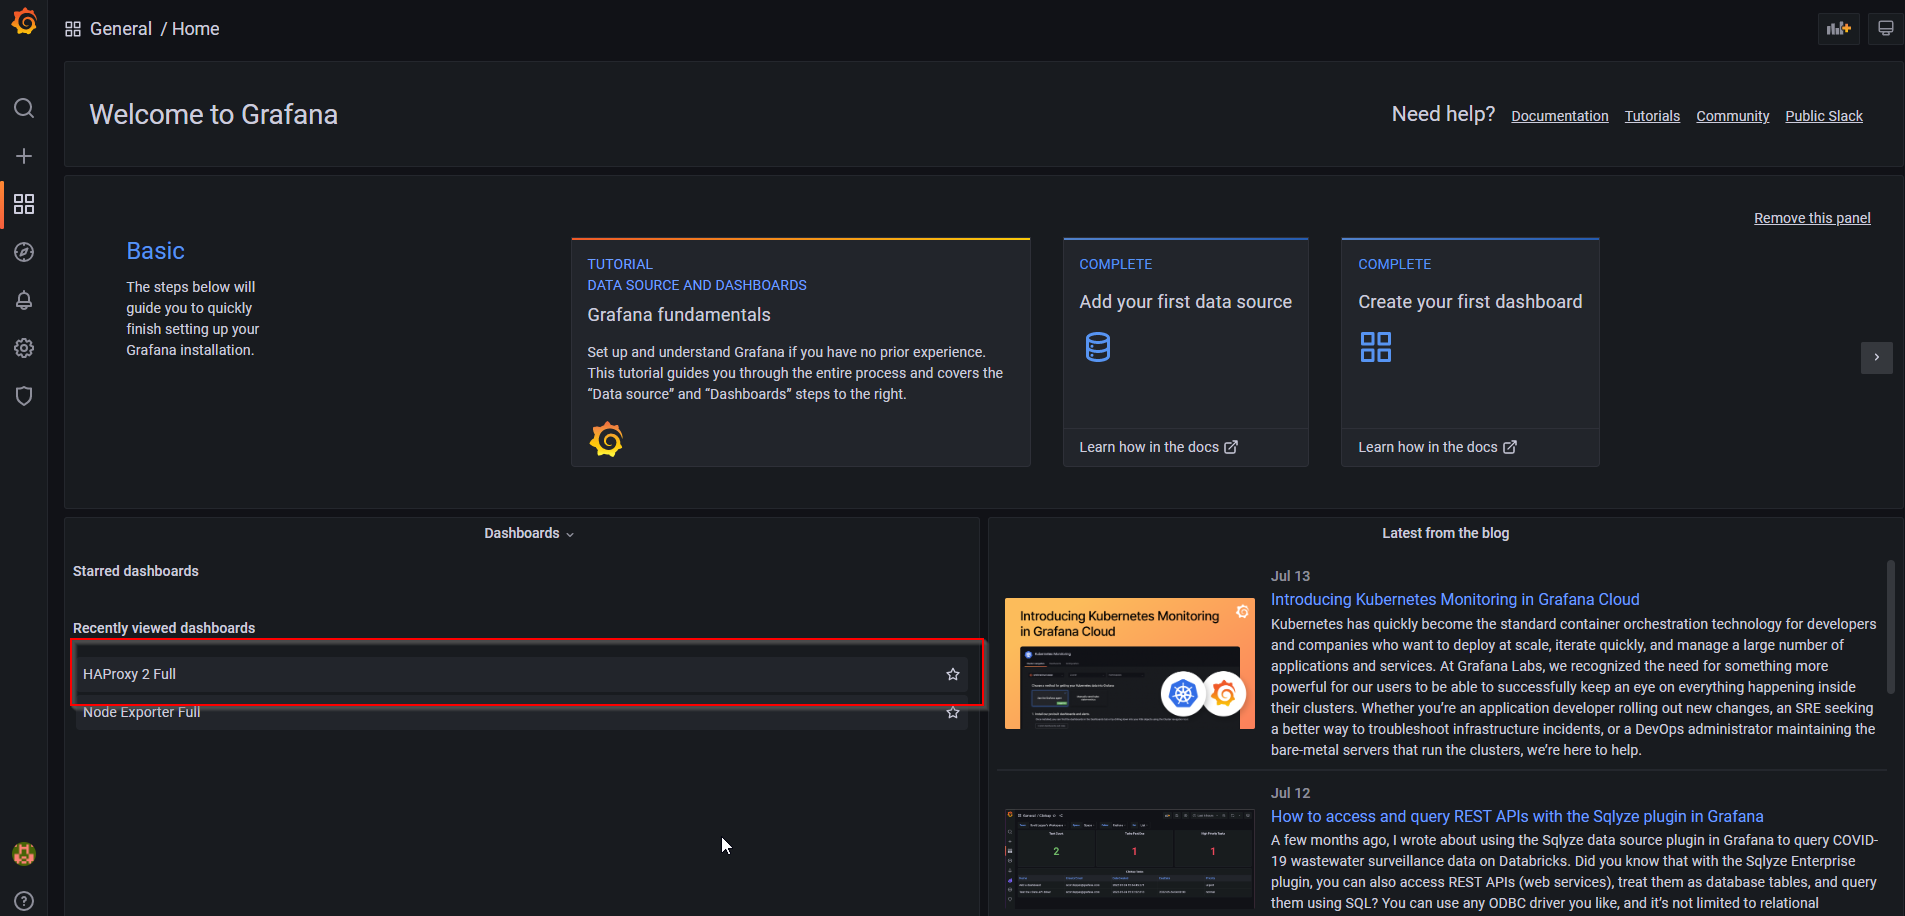
The dashboard should be visible here
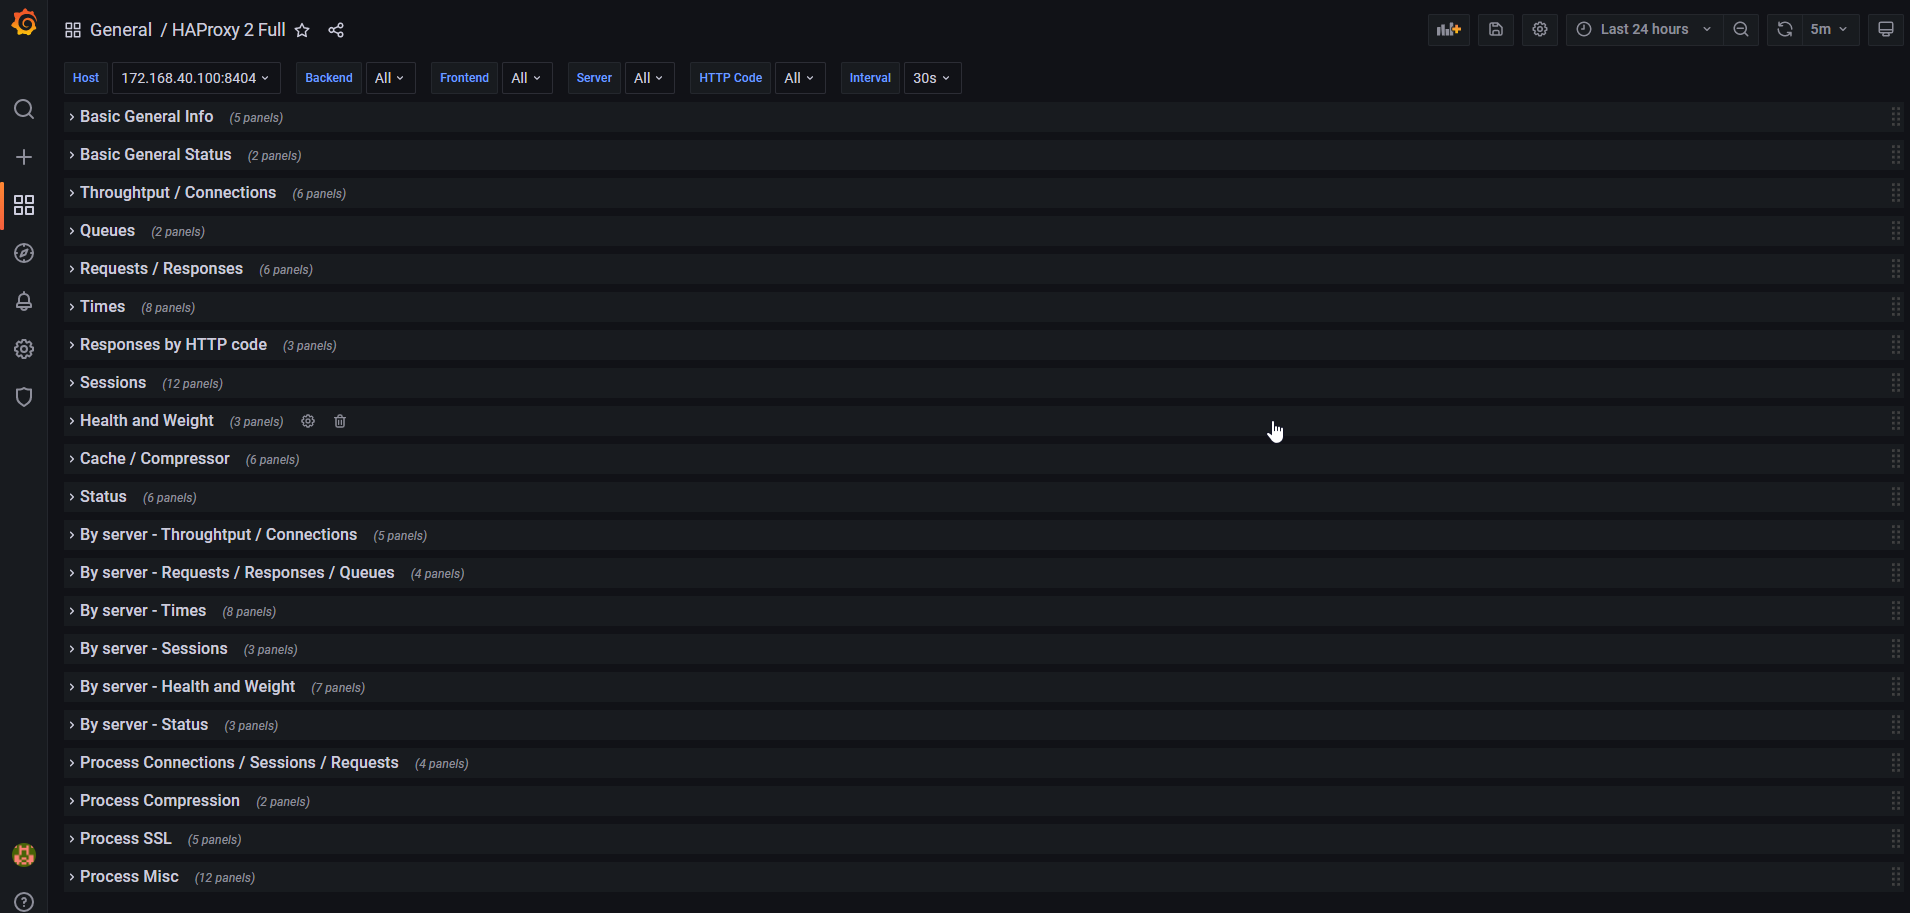
You can expand any statistic to get a full representation of how your ingress/egress is performing, as well as health statistics of the proxy service
Configure a telegram bot
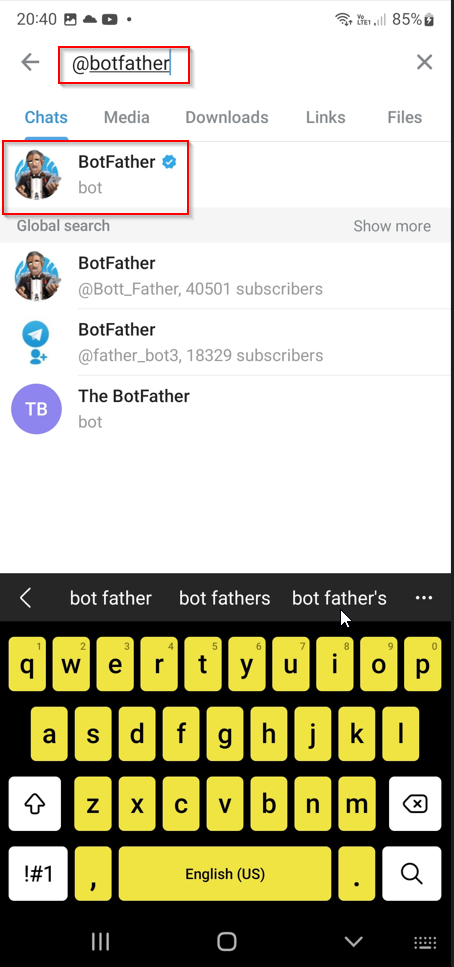
Open Telegram, and create a new Bot by searching for @BotFather. Select the certified one as per the identification badge
Click on start

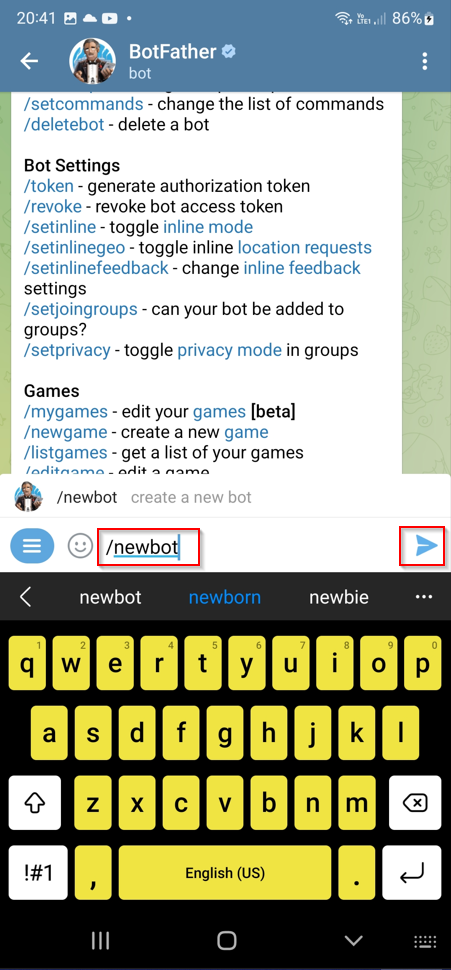
Create new bot
Choose a name for the bot

Create username for the bot

Take note of API token and bot link
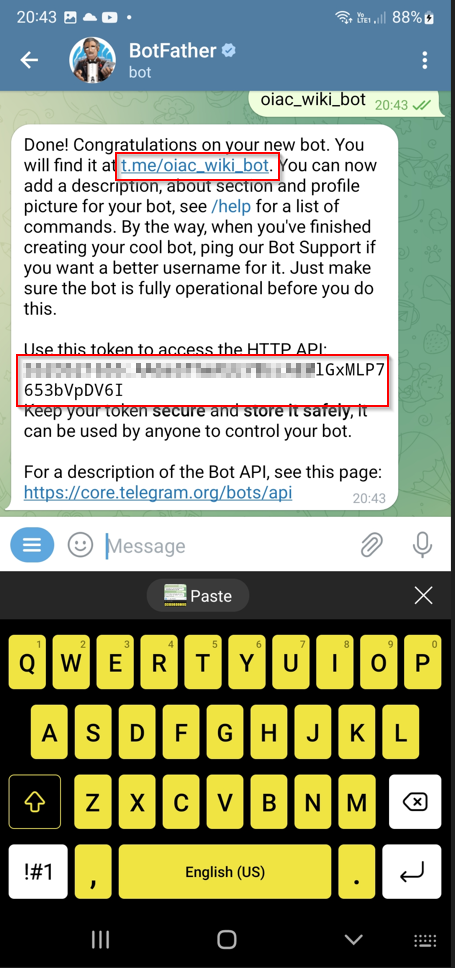
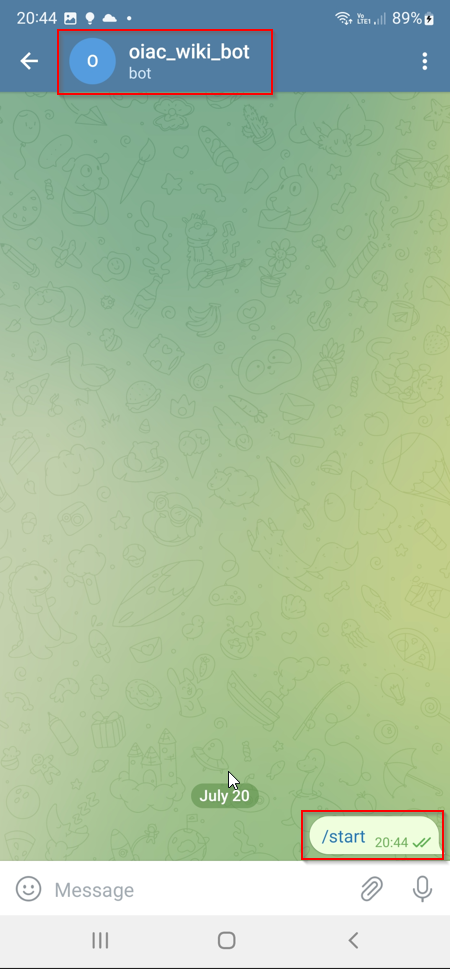
Start the bot

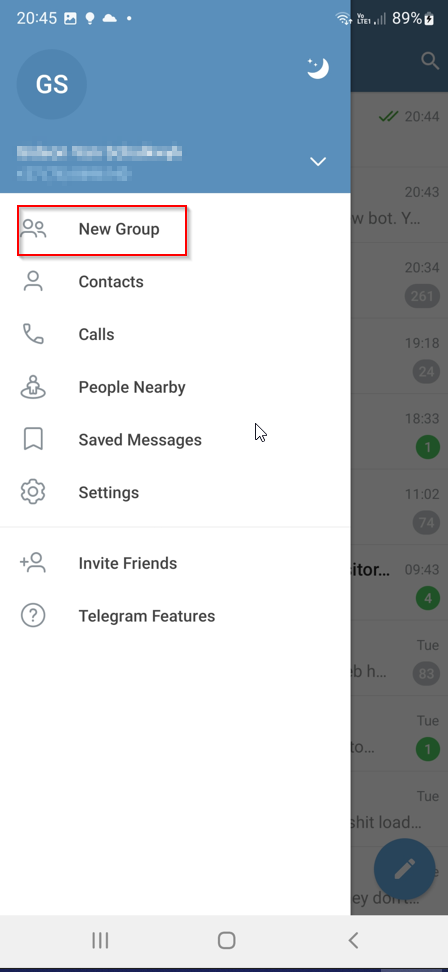
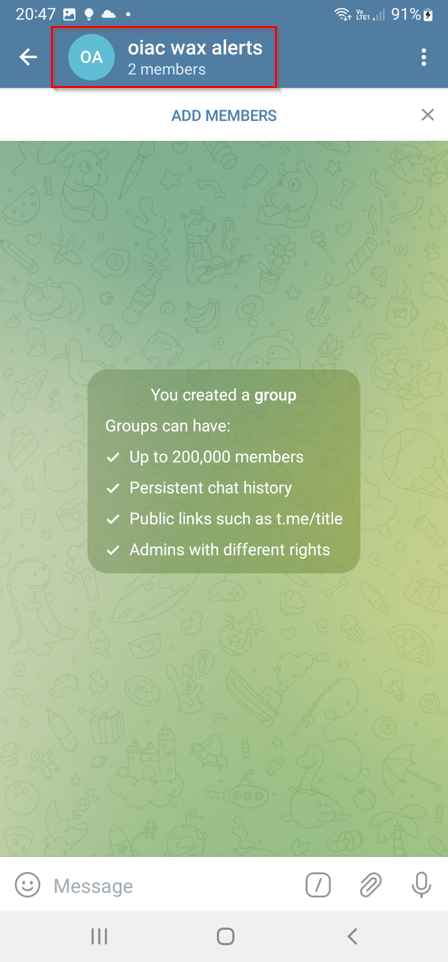
Create a new group in telegram
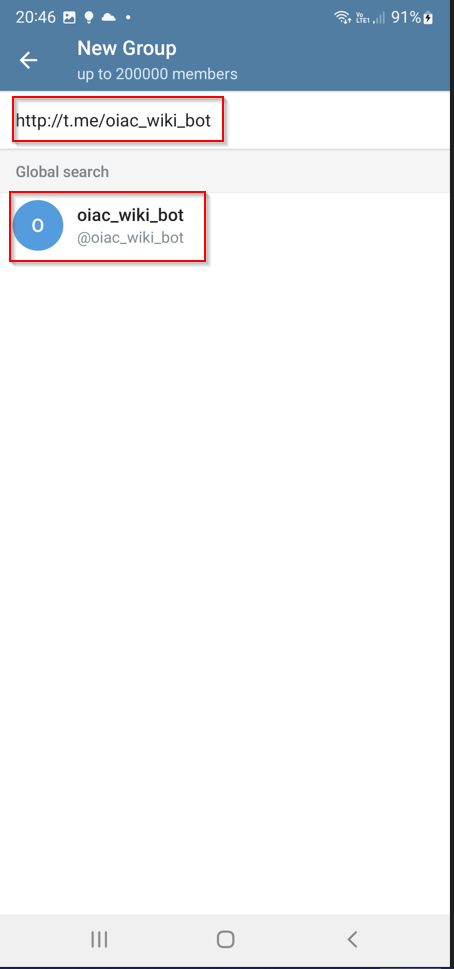
Add the bot to the group (find by bot link)
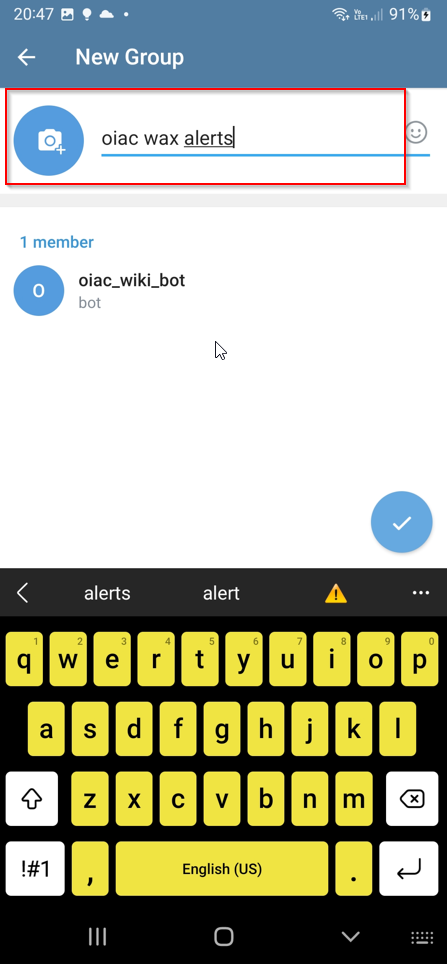
Select a group name of your choice (where you want to receive your alerts)
Verify that the newly created group exists
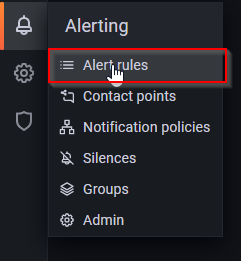
Configure contact point
Proceed to alert setup
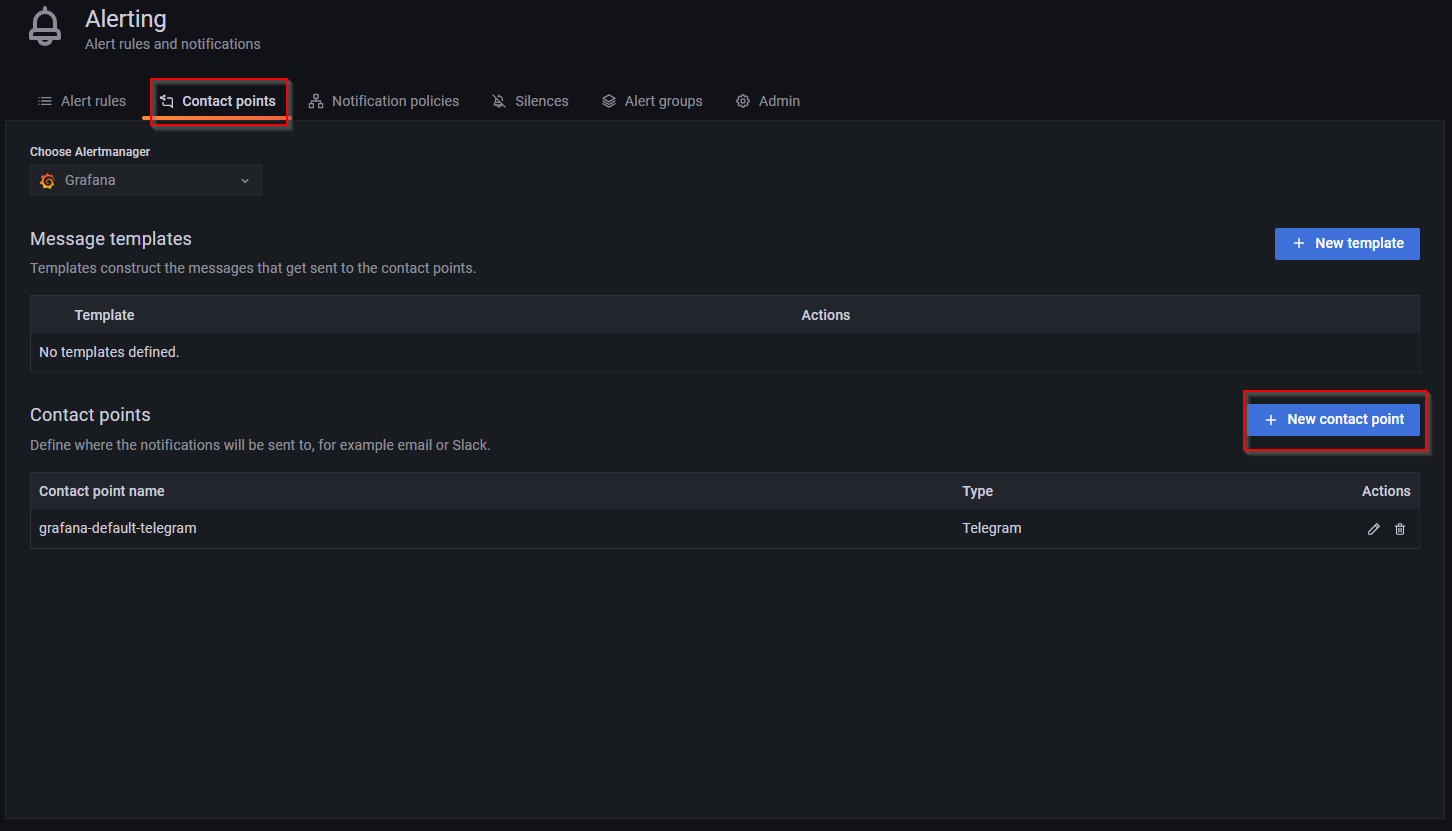
Create a new contact point
Select a name and type for telegram alert spec
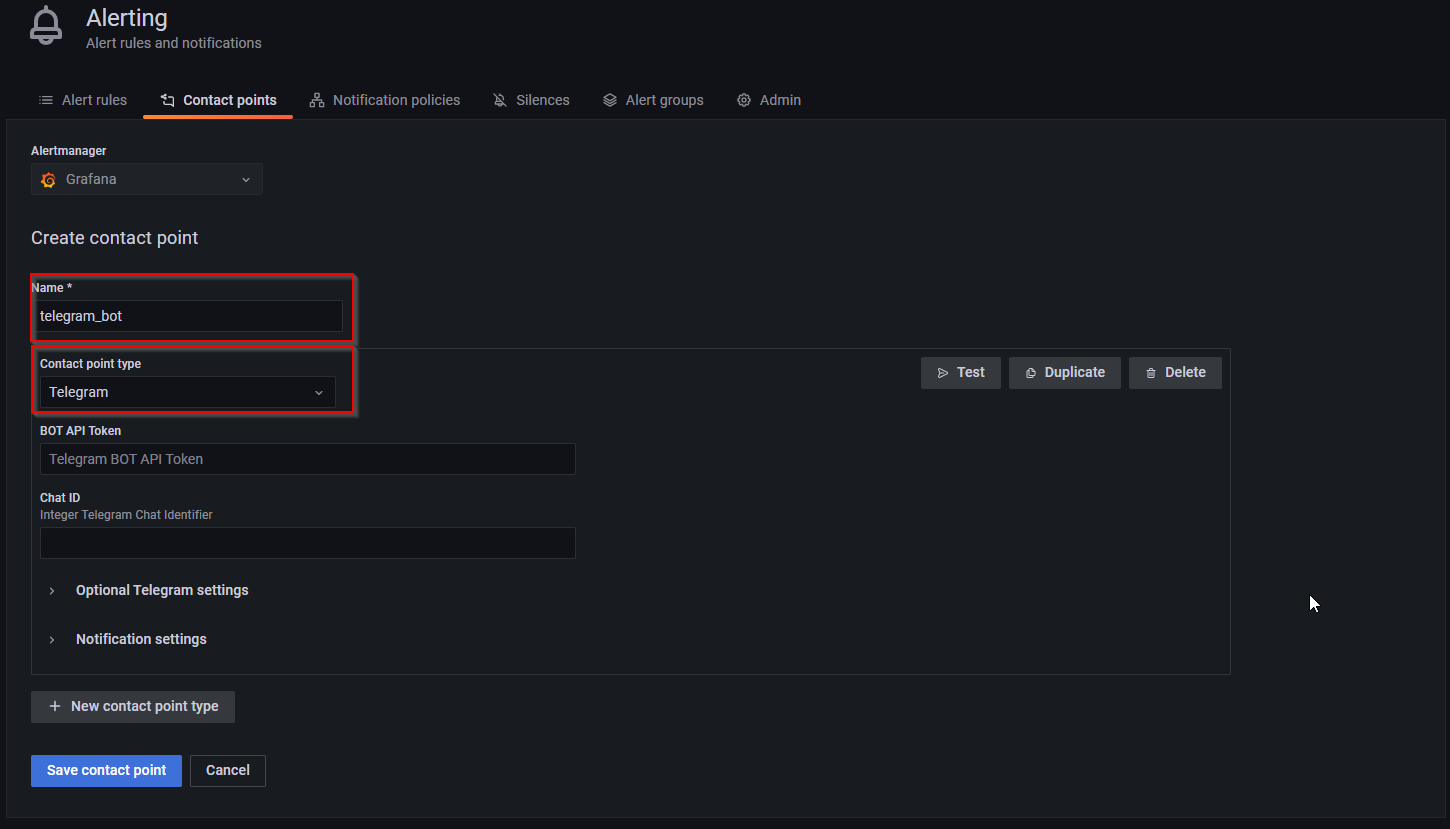
Enter you bot API token, see previous section on configuring your telegram bot (data should still be in your telegram)
Enter your chat ID for your group (can be gathered by viewing the group info) will only work if you bot has been started. See previous section
Your chat ID with the numeric digits prefixed by the '-'
Alternatively, you can open telegram web, proceed to the group and retrieve your chat ID which is indicated by your url after the # sign
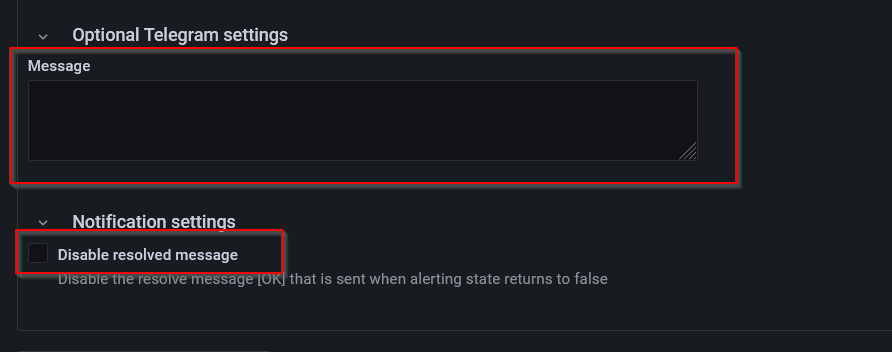
Leave your message empty and notification settings empty and click on save
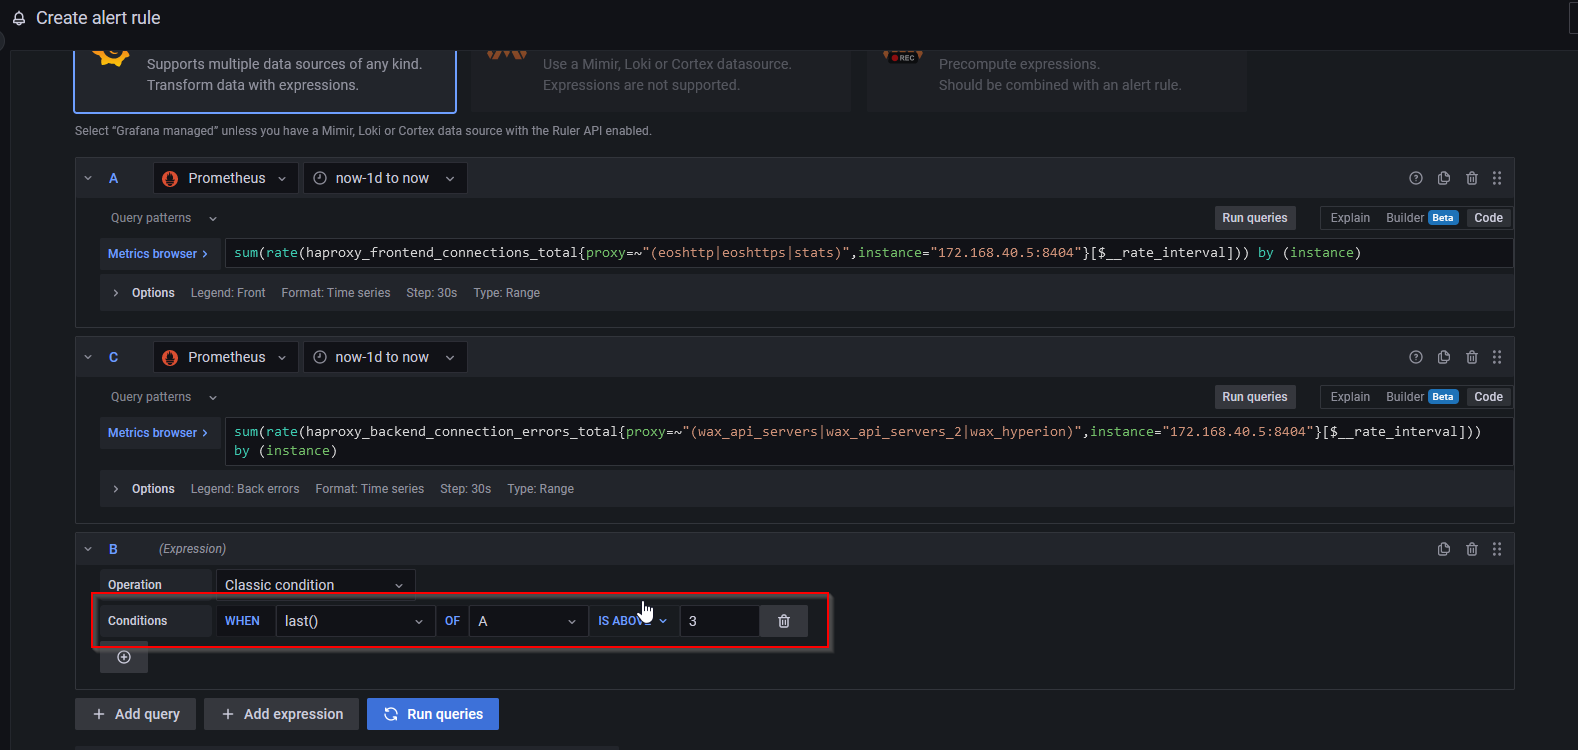
CConfigure Alerting in Grafana to post alert messages to telegram
Browse to your dashboard and select the graph you want to be alerted on (in my case number of connections)
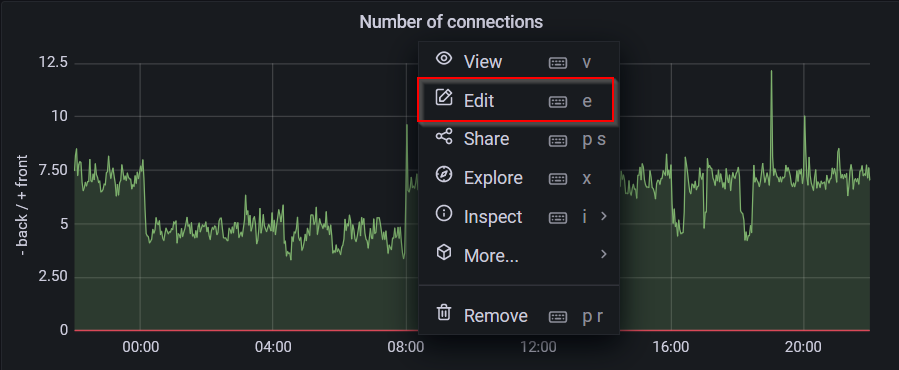
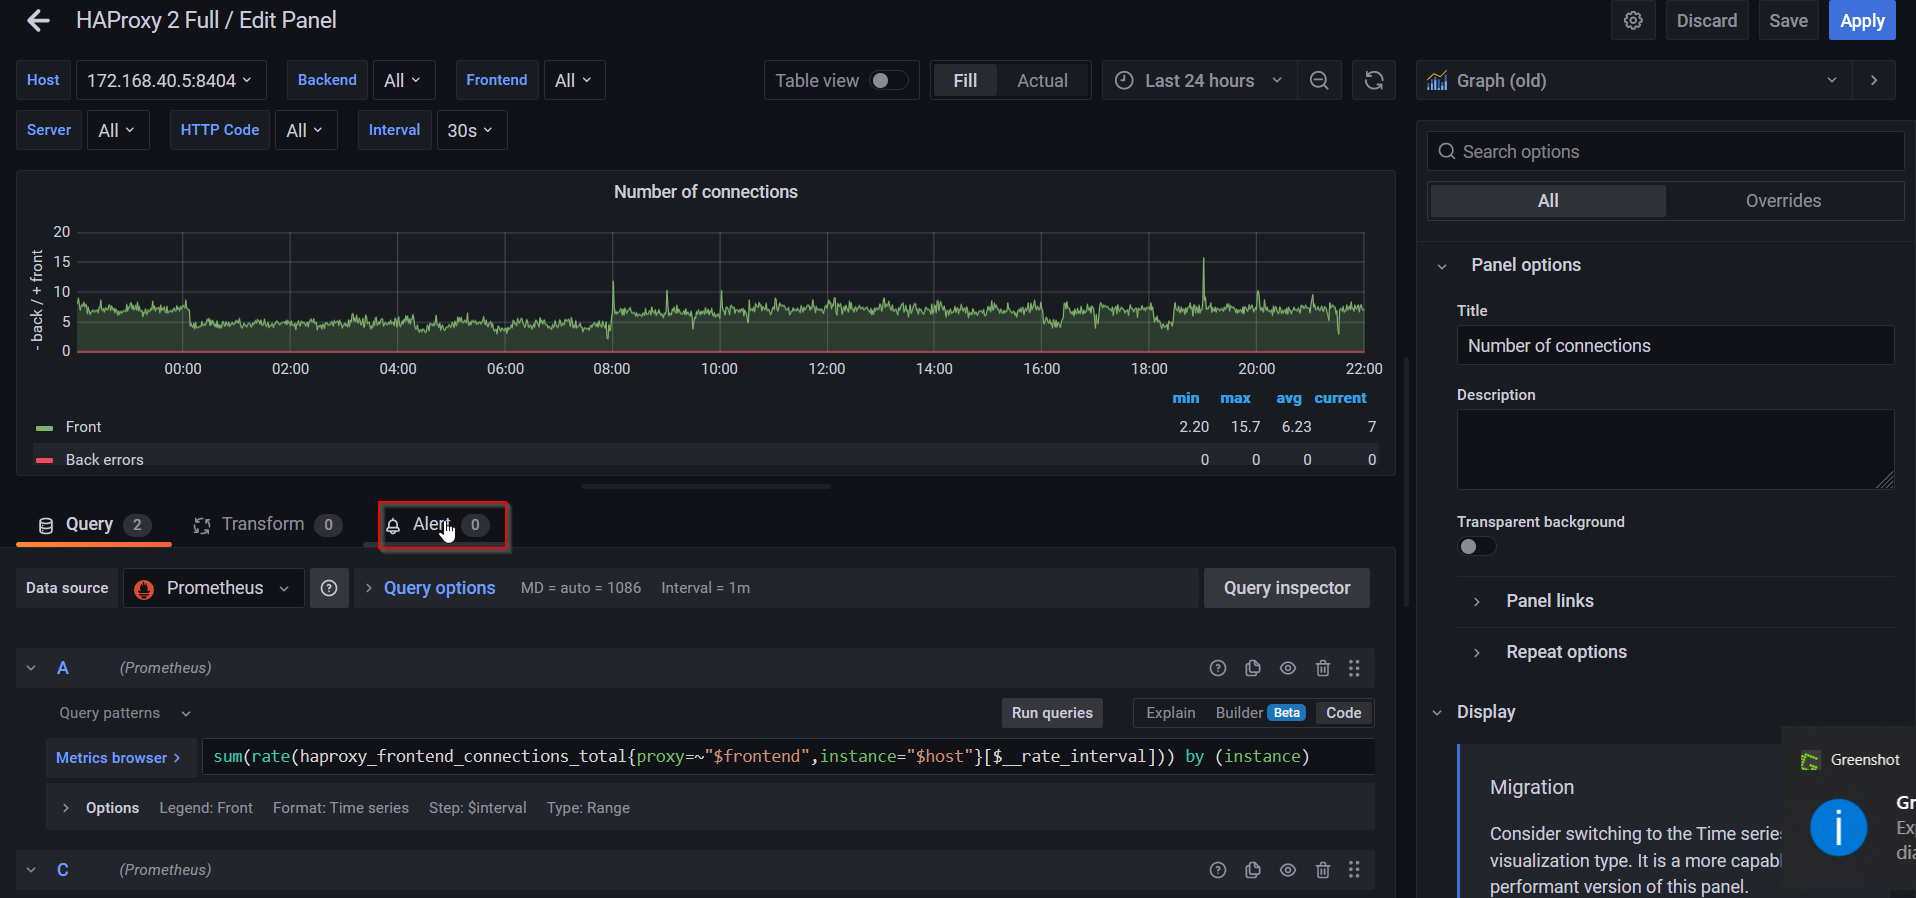
Click on alert for the graph you are editing
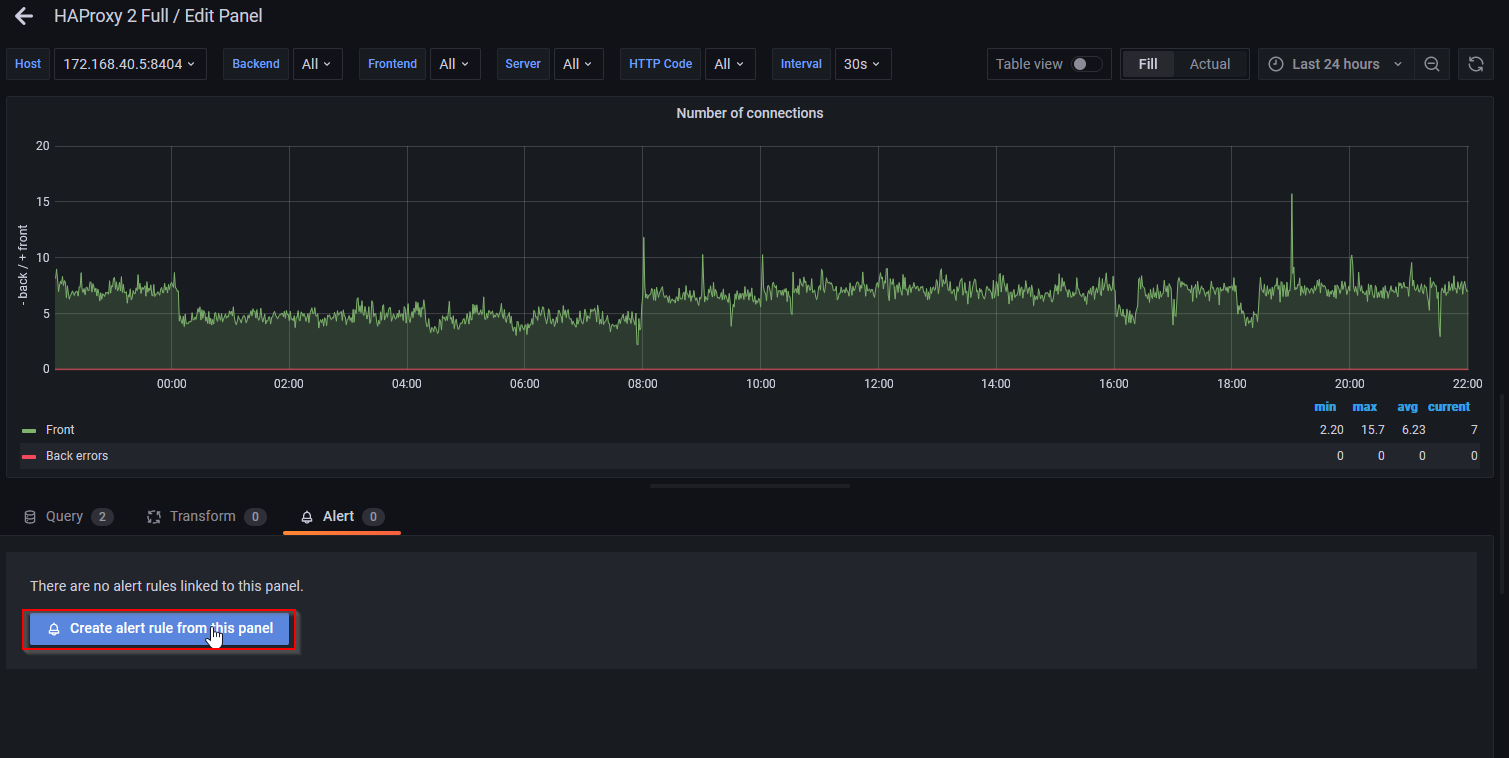
Create an alert
Choose alert condition (in my test, I alerted on connections exceeding 3)
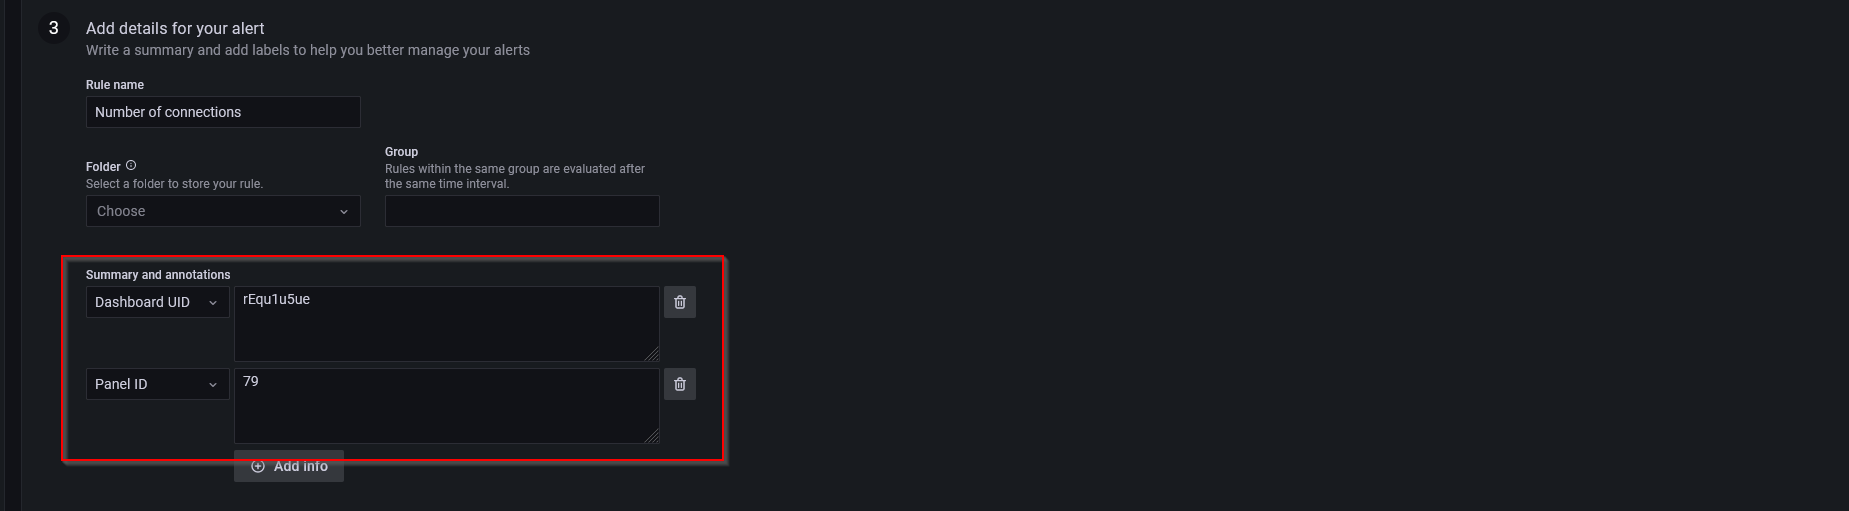
Put annotations to your alert notifications to make it more fruitfull
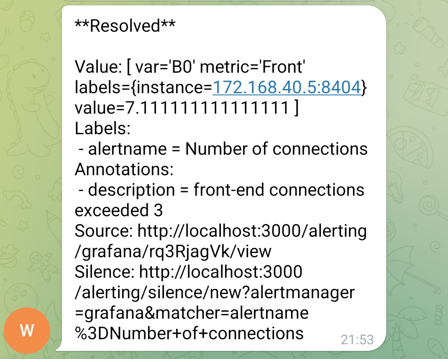
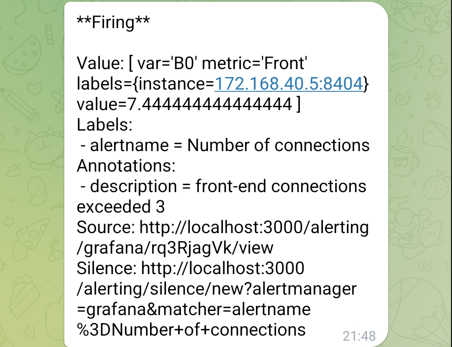
Save your alert and exit. Then if you condition is triggered, await your alert on telegram
When the issue has cleared (I have deleted the alert to just show the resolved status, ignore the value)